Horse Racing Draw Bias Explained: Why Stall Number Changes the Bet
 Available in US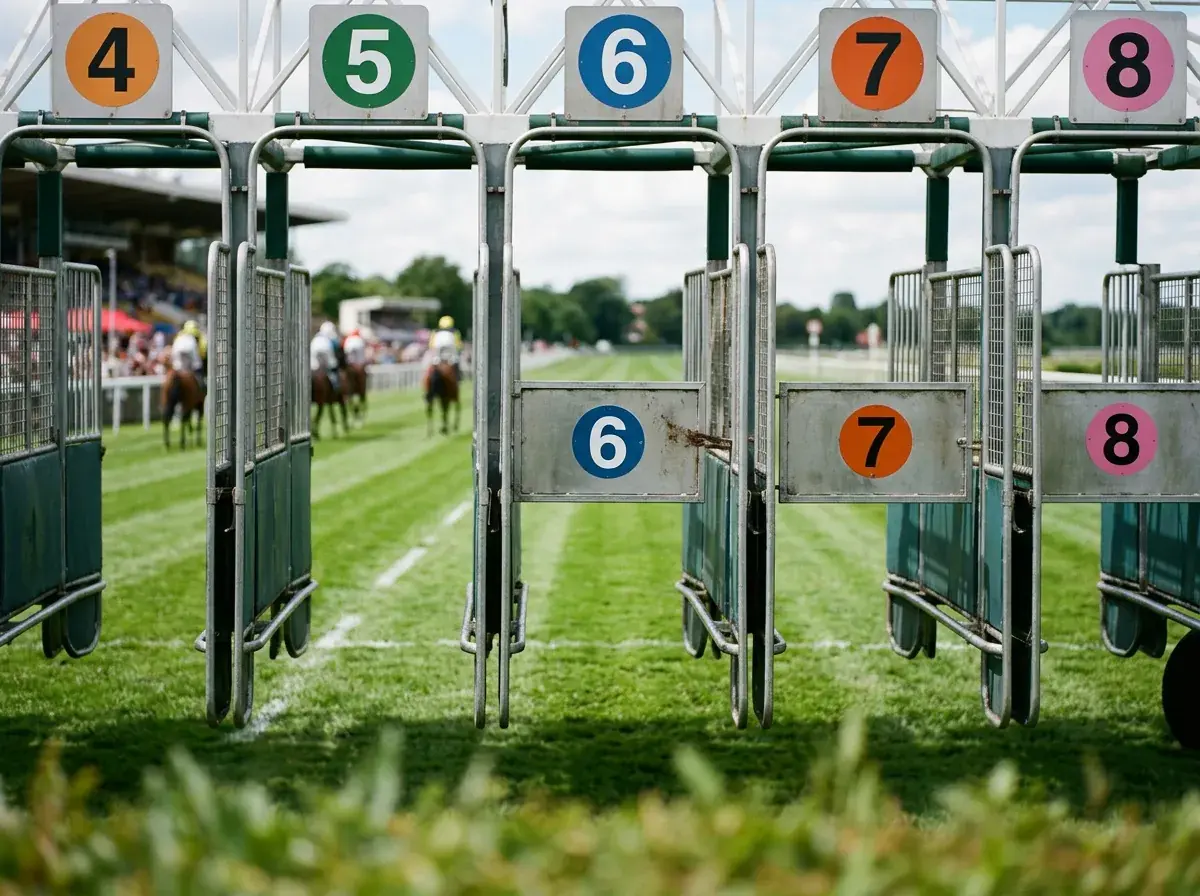
The Factor That Hides in Plain Sight
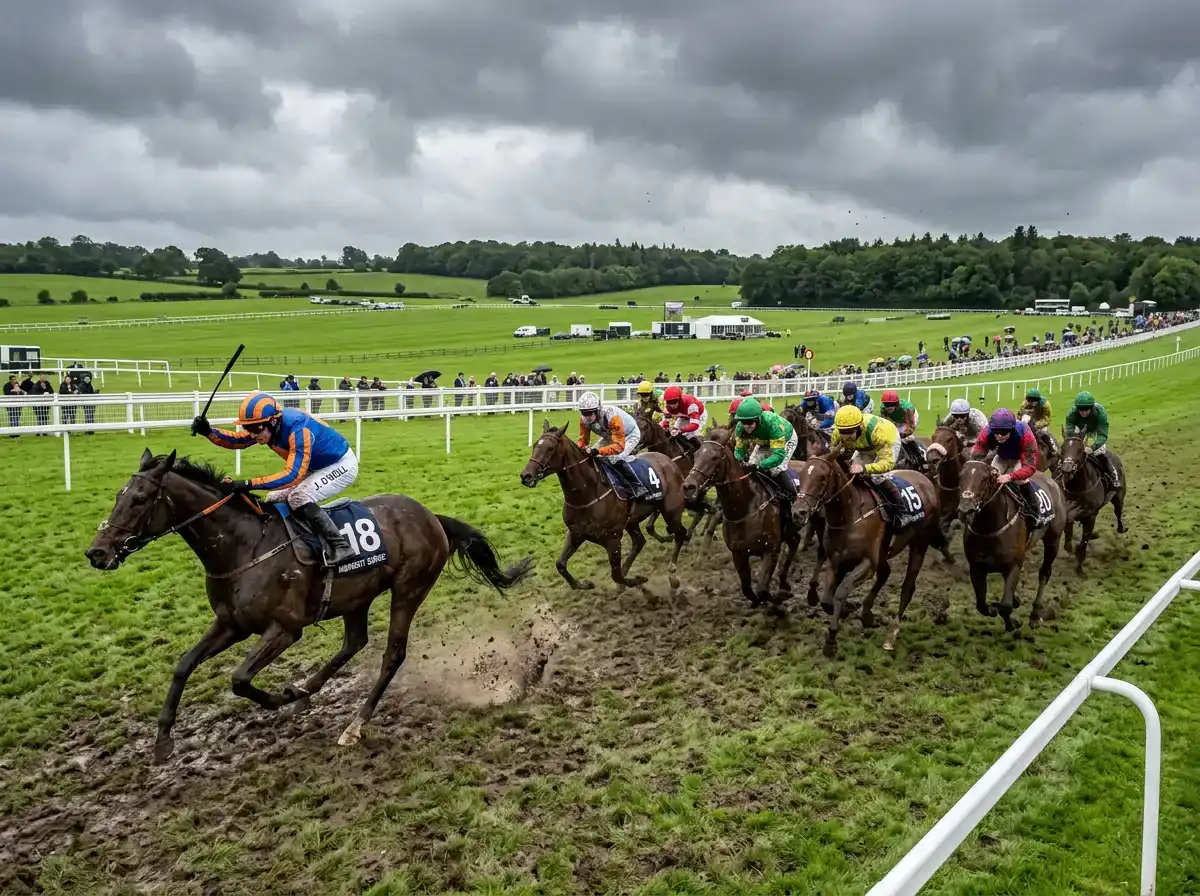
I once watched a 12-runner Chester sprint where the horse I had backed at 7/2 from stall 11 was, statistically speaking, almost out of the race before the stalls had finished opening. He finished eighth, beaten about seven lengths, having raced wide for most of the trip. The horse who won, an 8/1 shot from stall 2, never came off the inside rail. Same race, same ground, same six furlongs. Different starting positions. Different races, effectively.
Draw bias is the systematic effect where the number of the starting stall influences a horse’s chance of winning, independent of any other factor. On some courses it is mythology. On others it is the single biggest variable in the race. The trick is knowing which courses have which kind of bias, when the bias is active, and how to weight it against the form-based factors most punters focus on.
Find the best options for best bet in horse racing.
What Actually Creates a Bias
Draw bias arises from three structural features. The first is course shape. Tracks with sharp bends near the start force horses on the outside to cover meaningfully more ground than horses on the inside. Over a 5-furlong sprint, an extra 15 metres of distance is the difference between winning and finishing fourth. Over longer trips, the bias diminishes because horses have time to find rhythm and the early disadvantage is recoverable.
The second is ground variation across the width of the track. Most UK courses receive uneven watering, and tracks that camber slightly toward one rail accumulate softer or firmer ground on one side. A horse drawn over the softer strip on a heavy day, or the firmer strip on a fast day, is racing on different conditions from a horse drawn ten stalls away. Race-watchers who walk the course on the morning of the meeting often see visible differences in turf colour and standing water that translate directly into pace differences during the race.
The third is the interaction between starting position and pace. Horses drawn near the rail can race close to the inside without needing to consume energy crossing other runners. Horses drawn wide have to either race wide for the trip — paying the geometric cost — or expend energy and risk interference moving across to the rail. The optimal draw depends on race pace, and the pace depends on the horses in the race.
These three factors combine differently at different courses. A few UK tracks have permanent biases dictated by their layout. Most have variable biases that activate or deactivate depending on field size, going and race distance. Understanding the difference between permanent and variable biases is the first analytical step in using draw effectively.
The Courses Where Draw Defines the Race
Chester is the most extreme draw-biased course in UK flat racing. The track is a tight, near-circular shape with the start of most races set close to a bend. Low-drawn horses can break smoothly and race on the inside throughout, while high-drawn horses are stuck wide and pay a meaningful geometric cost. In short and middle-distance races at Chester, the low draws win disproportionately, and the bias is strong enough that good form-readers will downgrade or upgrade horses by several lengths based on stall allocation alone.
Beverley’s five-furlong sprint course is another extreme. The track’s stiff uphill finish combined with a sloping start area produces a clear bias toward high draws in straight sprints — high-drawn horses get a slightly higher start position and the geometric advantage on the run-in. The strength of the bias varies with field size, but in 12-plus runner sprints the high-draw advantage is large enough to materially shift the market.
Goodwood’s draw effects are more nuanced. The undulating course shape means different races on different distances produce different draw biases. The five-furlong stalls are set on a slope that favours certain stall numbers; the seven-furlong track introduces additional cambers. The Sussex meeting in July tests every type of draw effect in different races on the same week, and serious punters at Goodwood often adjust their selections race-by-race based on visible bias from the early races on each card.
Other courses with notable but more variable biases include Thirsk, Ripon and Newmarket’s Rowley Mile. Newmarket in particular sees occasional strong straight-course biases — the historic “stands’ side” or “far side” advantage that produces visible bunching of winners along one rail during certain meetings. Lingfield’s all-weather configuration shows a notably high overall favourite win rate of around 50% across recent reporting, the highest of any UK course, partly because the track’s structure favours consistent and predictable race patterns that match market expectations and partly because the draw biases at Lingfield are stable and well-priced into the market.
The courses without meaningful draw bias are roughly as important to know. Newmarket’s July Course, Ascot’s round course, the Curragh — these are tracks where draw is largely a distraction and form analysis matters more than stall number. Knowing which courses to ignore on draw is half the discipline.
How Field Size Changes Everything
Draw bias scales heavily with field size. A 7-runner race on a draw-biased track usually shows little or no bias because horses have room to find their positions without geometric penalty. A 20-runner race on the same track at the same distance shows the strongest bias of the year, because the field bunches and the geometric and ground-related costs of being drawn wrong become unavoidable.
The threshold where draw effects become decisive is usually around 10 to 12 runners. Below that, individual form and pace dominate. Above that, draw becomes a structural factor that needs explicit weighting in your analysis. The 2025 average field size on UK flat racing was 8.90 — down from 9.14 the previous year — which means the average UK flat race sits just below the threshold where draw bias dominates. Royal Ascot, with its 24+ runner handicaps, sits well above the threshold, which is why draw effects at the meeting are visibly active even on tracks that show less bias the rest of the year.
The implication for race analysis. Check the field size before weighting draw. A 6-runner Chester sprint is mostly about pace and form. A 16-runner Chester sprint is about the draw first, with form as a secondary filter. The same horse drawn the same stall has dramatically different prospects in the two race shapes, and the market often does not fully adjust for the field-size interaction.
Premier-fixture races, which carry larger average field sizes — the BHA’s 2025 data showed 11.02 average runners on premier-fixture flat races — produce more frequent strong-bias scenarios than the typical UK card. This is one reason that the premier fixtures attract sharper punting attention: the structural factors like draw bias and pace setup matter more, and the analytical edges are bigger because the variance the market has to price is larger.
Draw Bias Connects to Pace
The relationship between draw and pace is symbiotic. A pronounced bias toward low draws on a particular day at a particular track usually correlates with a pace pattern where the early speed is concentrated in the low stalls — horses drawn there can break sharply and race in the leading group without crossing other runners.
The reverse holds for high draws. A bias toward high stalls on certain track configurations correlates with pace patterns where the high-drawn early speed sets the race up for high-drawn finishers, while low-drawn closers get tangled in slower mid-pack traffic. The pace map of the race — which horses lead, which press, which sit, which close — interacts with the draw to determine the actual race shape.
This is why isolating draw from pace produces incomplete analysis. A horse with high early speed drawn in a favoured stall combines two advantages and is often a stronger bet than the form alone suggests. A horse with hold-up running style drawn in a position requiring early speed to be useful is often a weaker bet than the form alone suggests, because their natural racing pattern conflicts with the draw they have received.
The disciplined approach is to read draw and pace together. Identify the draw bias active for the day. Identify the early-speed horses in the race. See where the early speed is drawn. Predict the resulting race shape. Then ask whether each runner’s draw and run-style fits or conflicts with that shape. The horses with consistent fit are upgraded; the horses with conflict are downgraded. This is the analysis most casual punters never do, and it is consistently the source of value at draw-sensitive meetings.
Applying Draw to Real Bets
Practical workflow. Before placing any bet at a draw-sensitive track, check three things: the field size, the going report including any watering, and the early-race results on the day showing which draws have actually won. The market typically prices draw bias correctly across the season but lags in adjusting to in-day patterns — a Chester card where the first four sprints have all been won by low-drawn horses is telling you something the afternoon market will not have fully absorbed.
On extreme-bias tracks, an unfavourable draw can be enough to skip a race entirely. A horse you would have backed at 5/1 drawn at stall 11 in a 12-runner Chester sprint is closer to a 10/1 chance, and the bookmaker price has not adjusted to reflect that. Either pass the race or find another runner.
One related layer that interacts strongly with draw bias is going conditions. The way the ground varies across the width of the track, and the way different horses handle different surfaces, intersects with draw to produce the actual race shape on the day. The full discussion is in going explained from firm through to heavy, and reading the two factors together is the analytical work that distinguishes serious form-readers from casual ones.
The Edge That Sits in Plain Sight
Draw bias is one of the few factors in UK racing where the data is freely available, the patterns are documented, and the market still consistently underprices its impact. The reason is that draw effects look statistical rather than tangible — a punter watching the race sees horses racing, not stall numbers, and the geometric cost of a wide draw is invisible until you watch fifty races and start to see the pattern.
Read our detailed review of Reading UK Horse Racing Form: A Step-by-Step Analyst’s Method.
Treat draw as a primary factor at the courses where it matters and a secondary factor everywhere else. Read it together with pace. Watch the early races on each card to confirm or adjust your reading. Skip races where the draw eliminates your selection’s chance. Done consistently, this is one of the cleanest sources of edge available in UK flat racing — and it costs nothing more than the discipline to look at the stall number every time you check the racecard.
Is draw bias real or overrated?
It is real at specific courses, in specific field sizes, in specific race distances — and overrated everywhere else. Chester sprints, Beverley sprints, Goodwood across multiple distances, and Ascot’s straight course in large fields show genuine and measurable draw effects. Most other UK tracks show minor effects that matter only in extreme field-size scenarios. The error casual punters make is treating draw as either universally important or universally irrelevant. The discipline is to know which courses fall into which category and to weight draw accordingly — primary factor at the biased tracks, secondary or negligible elsewhere.
Which UK course has the strongest draw bias?
Chester is the consensus answer for permanent structural bias, with low draws producing a clear advantage in short and middle-distance races due to the tight, near-circular track layout that places the start close to a bend. Beverley’s five-furlong course is another extreme on the high-draw side. Goodwood produces strong but variable biases across different distances and going conditions on the same week. The strength of any specific course’s bias varies with field size and weather, and serious punters at draw-biased meetings adjust their assessment race-by-race based on visible patterns from the early races on each card.
Prepared by the Best bet in Horse Racing editorial staff.